Summary: Latitude vs. X
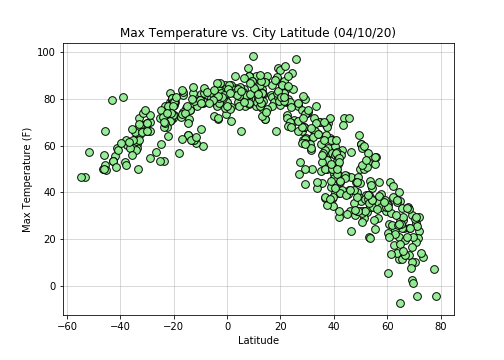
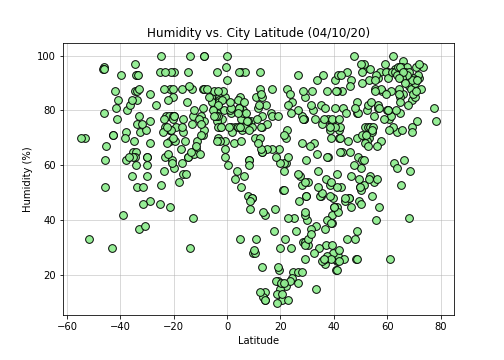
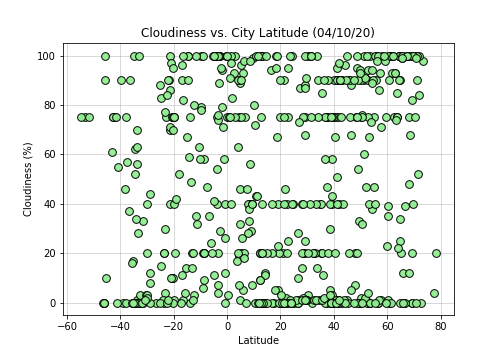
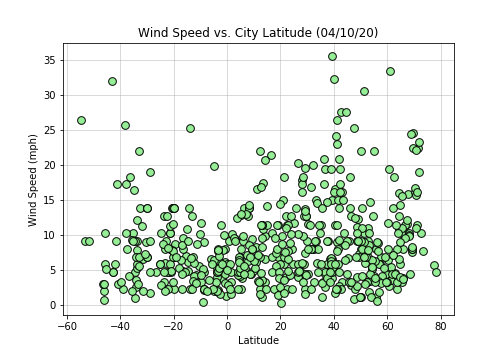
The purpose of this project was to analyze how different weather factors are changing with latitudes. The data for approximately 500 randomly chosen cities was pulled from citypy and merged with weather data pulled from the OpenWeather API to this dataset. Matplotlib library was used to create scatter plots to show relationships between latitude and four weather factors: maximum temperature, humidity, wind speed and cloud cover.
This is an image of one day's weather only and longer historical view would provide better insight. Also, it is estimated that 68% of the Earth’s land mass is in the Northern Hemisphere, while the rest (32%) exists in the Southern Hemisphere. These facts, together with opposite seasonal patterns, might impact our results. This web site provides source data, visualizations, and data analysis.
Visualizations